ISTL Recruit
-
 Interviews & feedbackVoice note in, finished scorecard out
 Finding peopleLinkedIn, databases and the web, safely
 Jobs & candidatesProfiles that show their source
 Inbox & schedulingReplies drafted, interviews self-booked
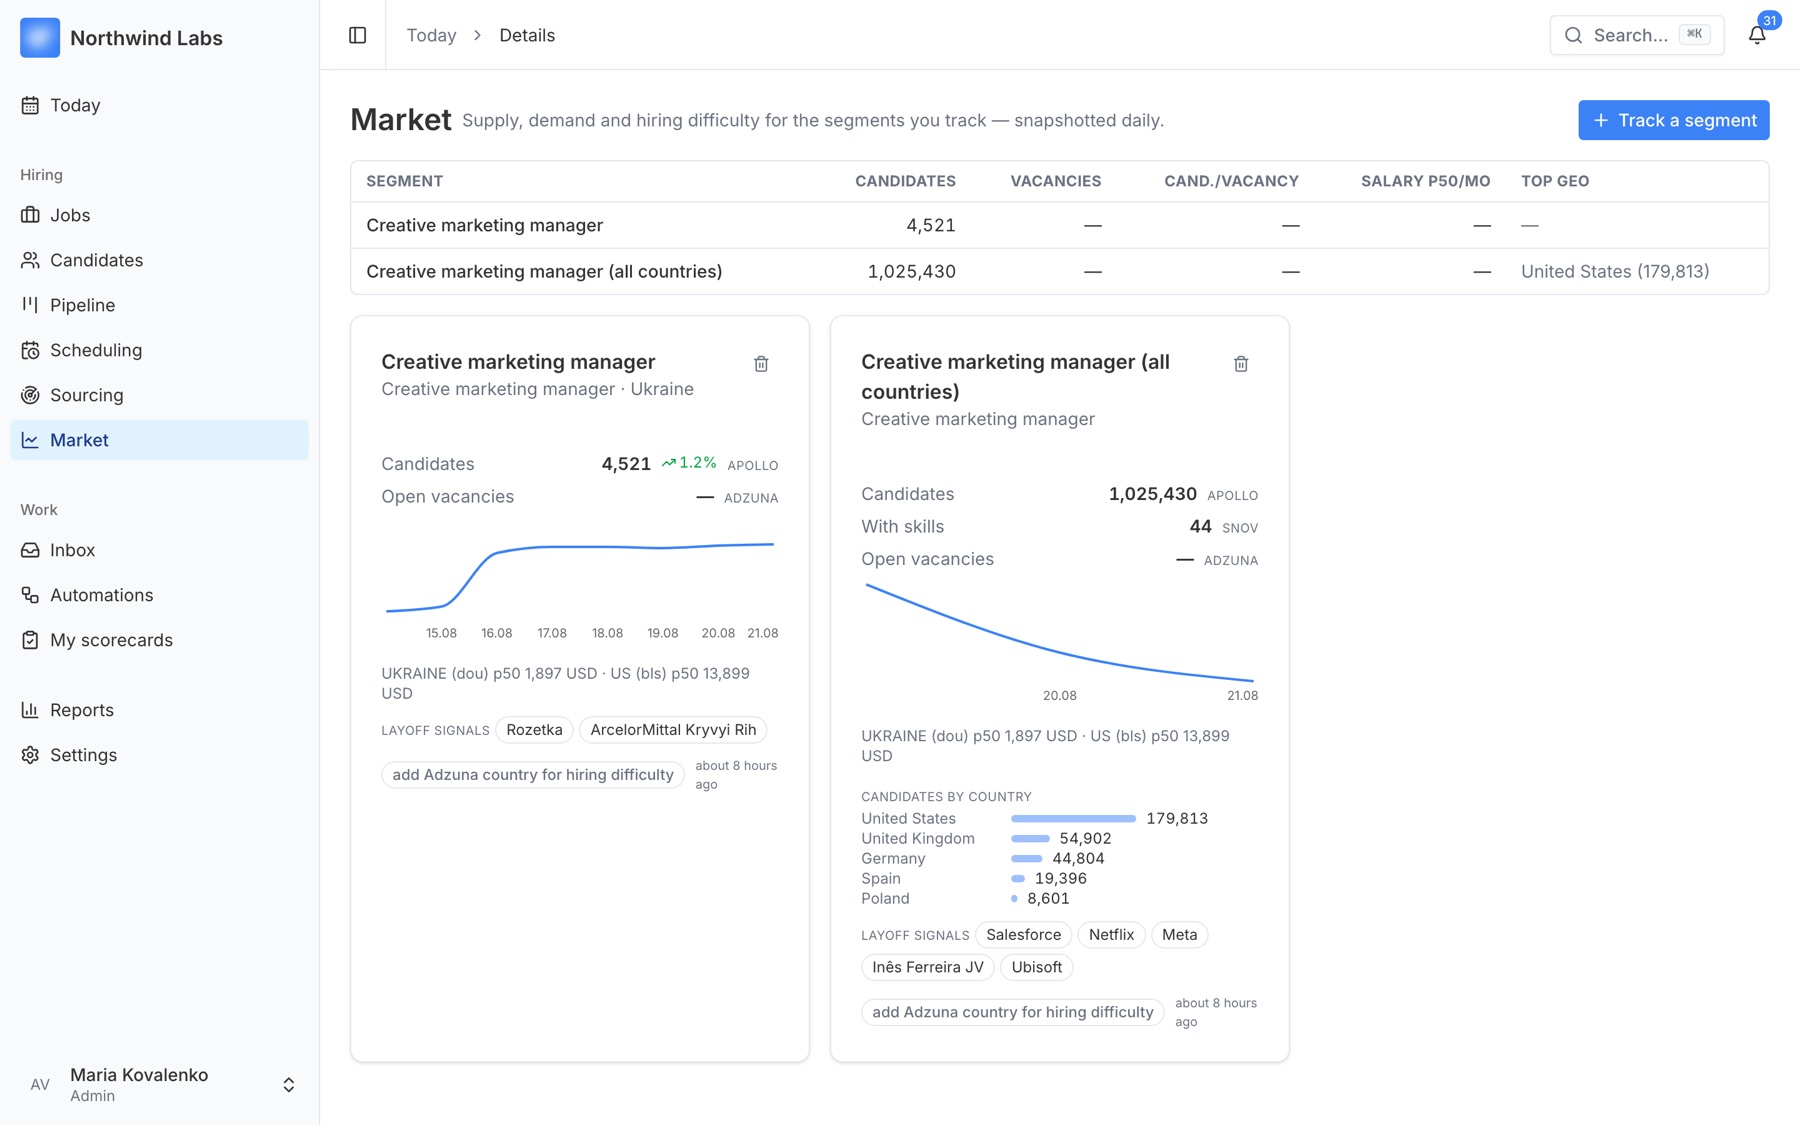
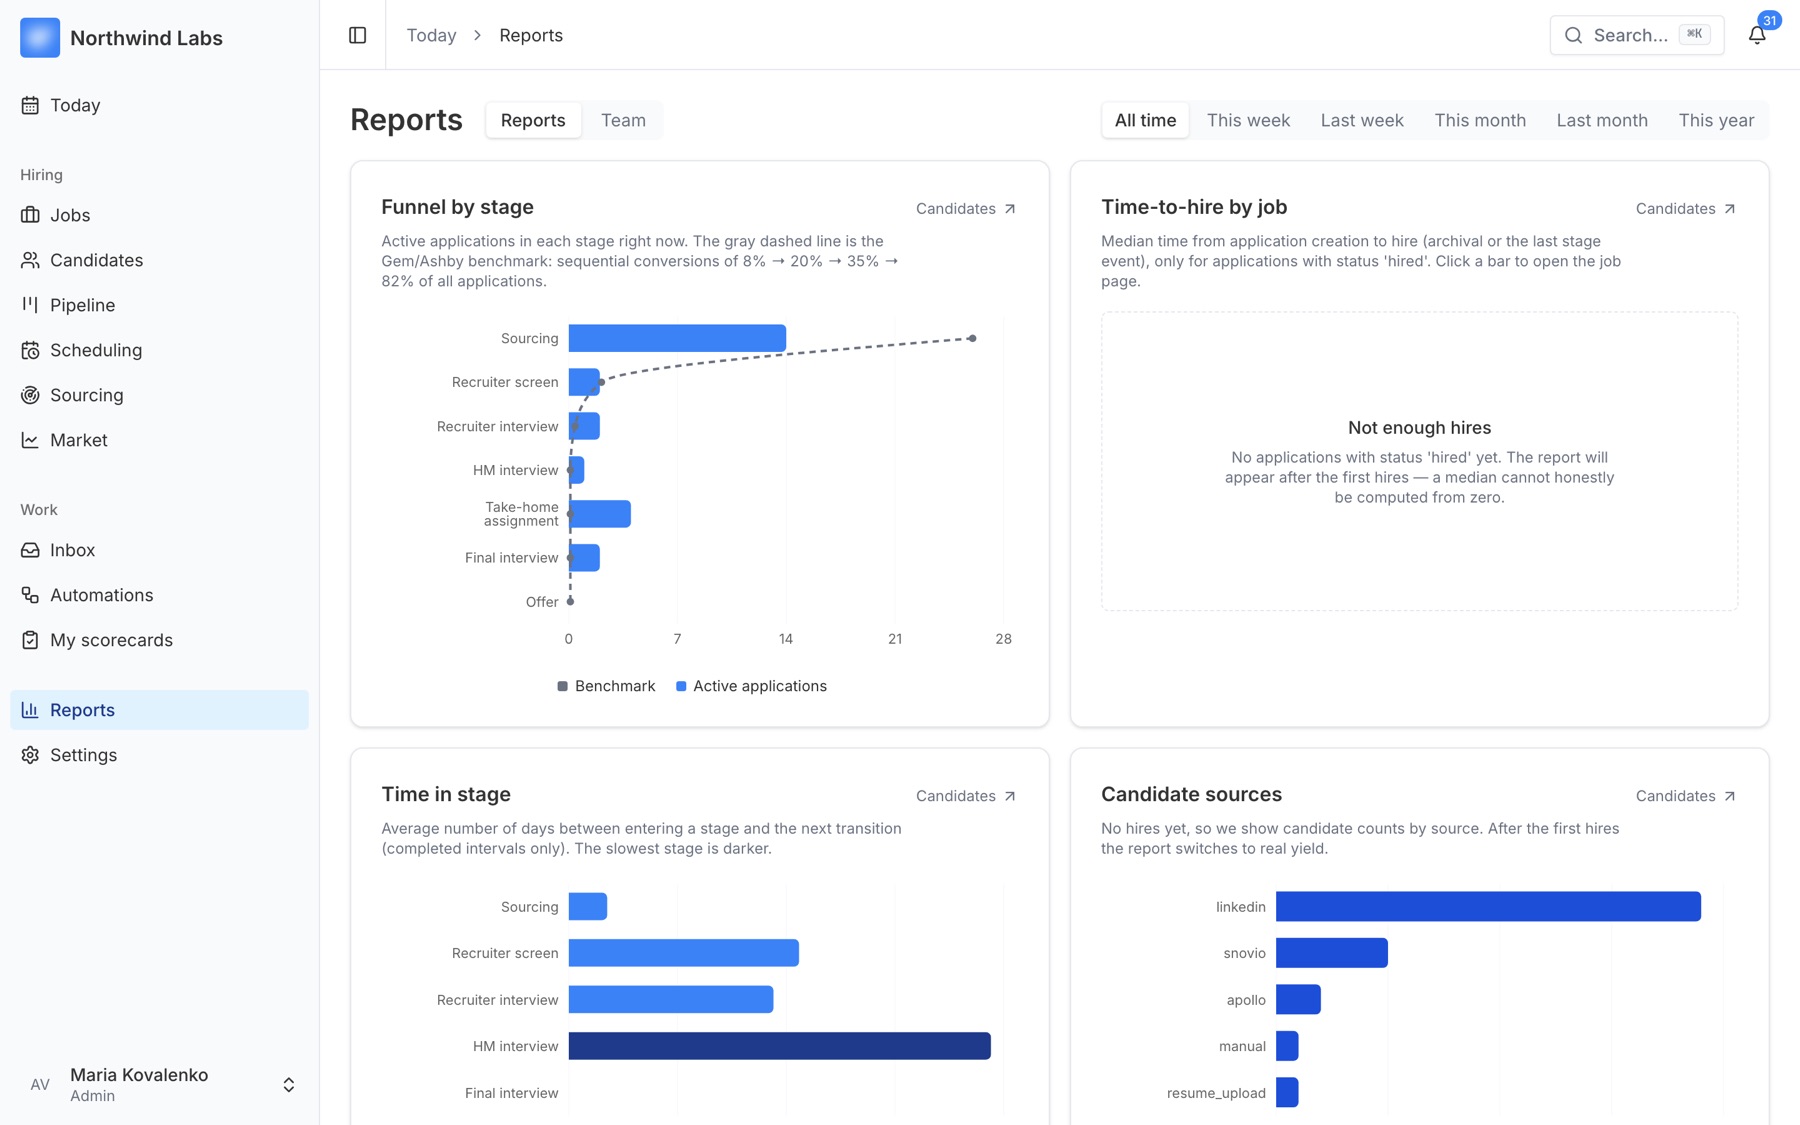
 Market & reportsSalaries, supply and your funnel
 TrustFair by design, auditable by default
 - A day with it
- Blog
- Trust
- FAQ

 CV (PDF)
 LinkedIn
 Email reply
 Voice note
 Interview